Revenue per visitor rose 23.75% when a Shopify store split live traffic between its original product page and an AI-rewritten version, according to Lian Lim (@dashboardlim), who built the workflow for the client and posted the result on X in September 2026.
we used AI to rewrite a shopify product page and recorded 23.75% higher revenue per visitor in a live split test i’m giving away the build breakdown, including the workflow and test results FREE first, here’s how it happened: the client had hundreds of descriptions to update across two stores so we built a process their team could keep running what’s inside the production workflow: → research competing product pages before writing → generate descriptions, comparison tables, faqs and image alt text → review drafts on a hidden store copy before testing → send completion reports to slack,
— Lian Lim | Dashboard & AI Automation Expert (@dashboardlim) · View on X
The store is not named. The post promotes a full breakdown that Lim sends on request, and the 23.75% lift is the only number shared publicly.
Before
The client had hundreds of product descriptions to update across two Shopify stores and needed a process its own team could keep running. The post gives no baseline: no starting revenue per visitor, conversion rate or traffic.
What they changed
- Researched competitors first. Before writing, the workflow reviewed competing product pages.
- Generated more than a description. For each product it produced a description, a comparison table, FAQs and image alt text.
- Reviewed drafts before testing. Drafts went to a hidden copy of the store for review before any live test.
- Reported every run to Slack. Each run sent a completion report to Slack, with errors visible.
- Split live traffic. Visitors were split between the original page and the rewrite. The tools named are Shopify, Claude, n8n and Intelligems.
After
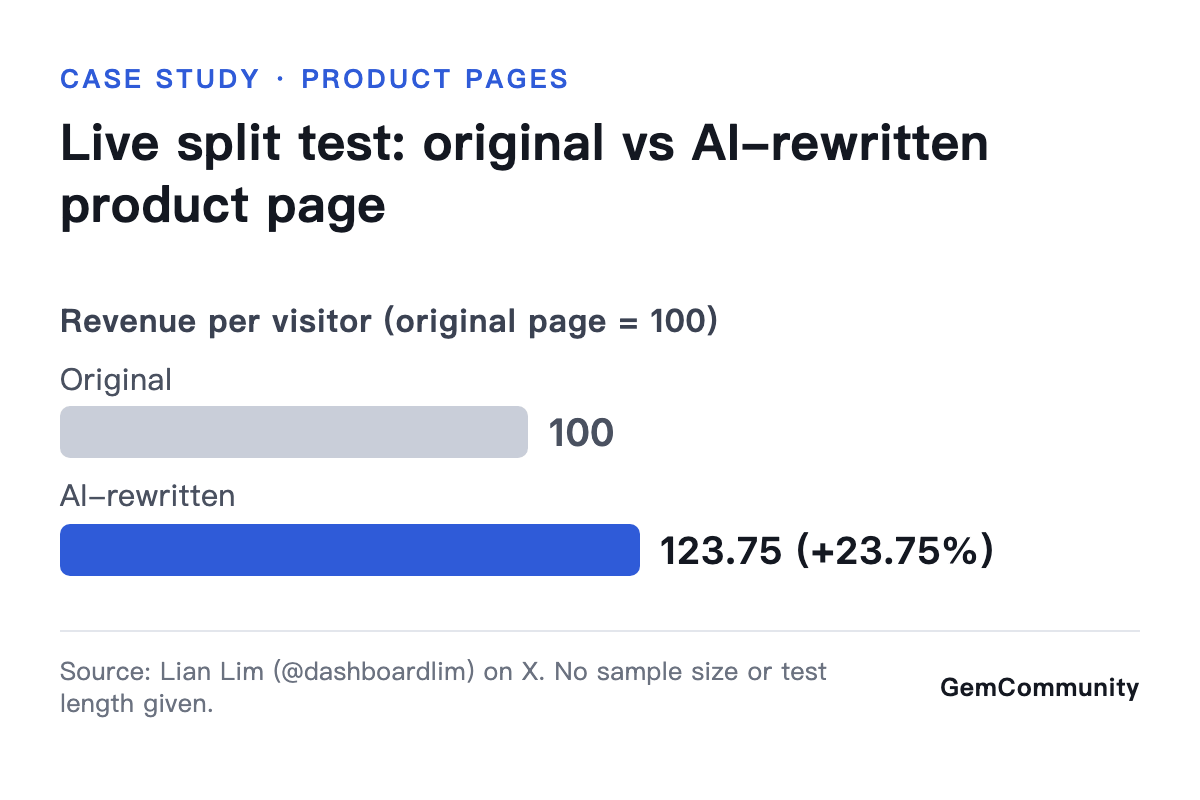
- Revenue per visitor on the rewritten page: +23.75% in the live split test.
The post does not give sample size, test length, conversion rate or statistical confidence, and it does not say whether the lift held after the test ended. The workflow was handed over for the client's team to keep running.
How can you test this on your store?
- Pick 5 to 10 products with steady traffic and thin descriptions.
- Collect the top three competing pages for each product and list what they explain that yours does not.
- Draft a description, comparison table, FAQ and alt text, then have a person check every claim against the real product.
- Split traffic 50/50 with a testing app and wait until each variant has enough orders to compare.
- Compare revenue per visitor as well as conversion rate, since a longer page can also change order value.
Frequently asked questions
What does revenue per visitor measure?
Revenue divided by the number of visitors to the page. It moves with both conversion rate and order value, so it shows the combined effect of a page change on sales.
Which tools were used?
Shopify, Claude, n8n and Intelligems, according to the post.
How reliable is the 23.75% figure?
It comes from one live split test on one client's store, and the post leaves out test length and sample size. Treat it as a direction worth testing on your own traffic.
Sources
- Lian Lim (@dashboardlim) on X: https://x.com/dashboardlim/status/2101390400292290676